Performance Monitoring Tools
In this second post we are diving into what tools you can use to capture the important performance metrics you need to gather for baselining your environment. Be sure to read part one here.
Performance Monitor
First let’s start with what comes native to Windows Server platform, whether you are on an Azure SQL Virtual Machine or your standard SQL Server instance install on premises you have a native tool, called Performance Monitor (affectionately known to most as PerfMon). This reliable tool allows you to easily monitor performance metrics through a Graphical User Interface (GUI), by selecting performance counters for the operating system as well as installed applications such as SQL Server. It groups these metrics for ease use by category and application specific counters. It is one of the tools best used for collecting those baseline statistics for your system.
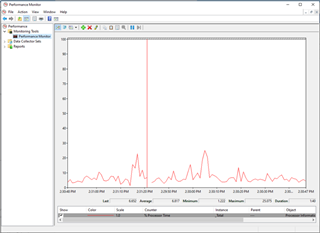
Figure 1
Figure 1 shows the reporting interface of Performance Monitor exactly how it looks when you first open it. You will notice by default it is already set to capture a single counter called % Processor Time. To get to Performance Monitor in Windows just type in PerfMon into your Window Search and launch the application. This is a real-time live tracker of performance and will begin populating upon opening.
Data captured by collecting log data from PerfMon can be stored locally and analyzed or even forward performance monitor results into Azure Monitor as well as other monitoring tools, where you can have a single view across many servers. How you choose the store and analyze the data is up to you. Keep in mind running PerfMon will incur overhead on your server, therefor tool is sometimes better to use for collecting data periodically rather than constant collection if the overhead becomes too much for your environment.
Now let us walk through how you can gather multiple metrics you can use for your baselines and to routinely monitor your environment.
Add Metrics
To add a new metric simply click on the + sign with the toolbar.
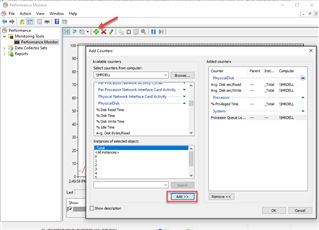
Figure 2
In Figure 2 you can see the next window after clicking the PLUS sign. This is where you see categories such as the PhysicalDisk counters. In this example, two counters under PhysicalDisk, one under Processor and one under the System category have been selected. To add each counter, you simply click on the counter you want then chose the Add button. This moves them to the Added counters window, once you have all counters you want chosen you hit ok to begin gathering those metrics immediately shown in Figure 3.
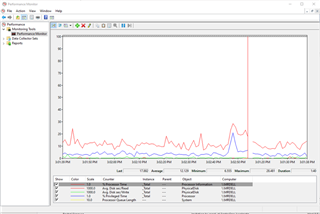
Figure 3
Results
This next Figure 4 shows a more detailed look. Note the Instance column. For these disk latency metrics, you can look per Disk as well as Total allowing us to pinpoint issues specific to any one disk lun. This can very useful handy for looking to see if you have latency issues on Tempdb for example if those files were set to their own drive letter.
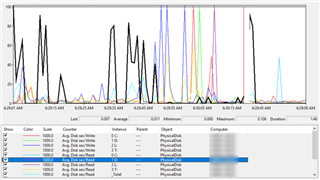
Figure 4
SQL Profiler
SQL Profiler is a built-in graphical user interface you get when you install SQL Server. It is another tool used to monitor a SQL Server instance; however, it is very different from Performance Monitor because it gives a more granular robust view into possible performance issues. This tool will allow you to find and diagnose things like slow-running queries by capturing the Transact_SQL statements running against your database engine. It does this via running a trace against your live workloads. The saved trace can then be used to replicate the problem to diagnose any issues. It is worth noting that this performance tool is deprecated, meaning Microsoft is no long investing in any changes or improvements and it may be removed from future versions of SQL Server. It is a very popular useful tool still used by a vast majority of database administrators.
Setting up a trace is very easy to do. Along with the ability to create your own specific trace events you can also take advantage of the built-in default trace, that provides a multitude of information. In this example will walk through setting up a simple trace to capture query statements.
You will find SQL Profiler under your installed Microsoft SQL Server Tools on your Windows start menu.
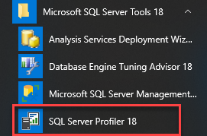
Figure 5
Start by creating a New Trace using the menu item under File. This will pop up the usual server connection window seen in SQL Server Management Studio. Next, you have the Trace Properties window. Here will name our trace, determine if you want to save the results to a file or write them out to a table. To be mindful of disk space it also allows us to limit our file size and/or roll over to a new file when the size is met. Lastly it gives us the ability to automatically stop the trace at a given time or once a time duration in minutes has been met.
As you know, collecting performance data can cause a large amount of resource overhead, you should try and limit your trace window to be inclusive of only the time frame needed.
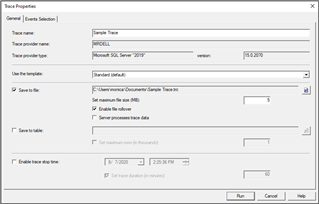
Figure 6
Next you choose the events you want to capture in the trace by moving over to the Event Selection tab.
The default trace looks like this shown in Figure 6
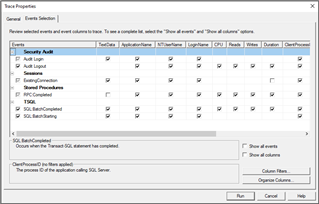
Figure 7
For this example, you will keep the default trace and add additional information to it. To see other events, you click the check box for Show all event. This will give us a full list of options by category. Under TSQL you can see options selected shown below in Figure 7 as well as a couple options under Store Procedures, SP:StmtCompleted and SP:StmtStarted to capture the executed statements against our database.
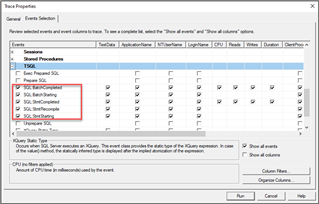
Figure 8
Results
Once you have chosen every event you want to capture as well as checked any columns you may or may not want to include in our result set you will choose Run and start the trace. Below is just a small section of data to show you what is captured. You can see the full TSQL run the user as well that ran it, CPU metrics, Reads, Writes and Durations.
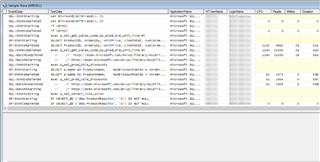
Figure 9
You can clearly see the abundance of information SQL Profiler can provide for you. It is really a great tool for deep dive troubleshooting and performance metric correlations.
Take caution into what you gather and how long you gather that information. The key to profiler is to get what you need so that you don’t spiral into spending hours and how wading through all the data to get the meaningful information you need.
Extended Events (XEvents)
Extended Events (XEvents) is the new, easily scalable, hotness for performance monitoring your SQL Server instances. Introduced in SQL Server 2008 it is what Microsoft is investing in to show performance metrics that would normally be ascertained through both Performance Monitor and SQL Profiler in one place. Compared to the 180 traceable and collectable events in SQL Profiler, Extended events has over 1800 in SQL Server 2019 and that number is expanding quickly. All new SQL Server features are instrumented with a XEvent, such as Availability Groups, In-Memory OLTP, and Windows Azure Storage are all now encompassed within XEvents. It is lightweight, easy to use, and creates significantly less overhead than its predecessors. Built into SQL Server Management Studio it comes with default sessions (targets and events) already created.
Extended Events also provides us the ability to aggregate and analyze the data live using the event_counter target (more on that later) which is a much needed feature not provided in either PerfMon nor SQL Profiler. This is a huge time saver. That along with the ability script out XEvents for recreation or use on another instance are valuable for scalability in large environments where you want to have a standard monitoring setup in place across servers. If only for these two reasons only it is a good idea to start learning Extended Events.
If you are used to using SQL Profiler and want to transition into using XEvents, Microsoft provides us with a T-SQL query that’s helps us to map the data field association between the two. If the values return NULL there is currently not an associated or meaningful equivalent. It may be useful to use to becoming familiar with these before jumping into creating your first XEvent session. You will find this helpful as you move on to using Extended Events.
USE MASTER;
GO
SELECT DISTINCT
tb.trace_event_id,
te.name AS 'Event Class',
em.package_name AS 'Package',
em.xe_event_name AS 'XEvent Name',
tb.trace_column_id,
tc.name AS 'SQL Trace Column',
am.xe_action_name AS 'Extended Events action'
FROM
sys.trace_events te
LEFT JOIN sys.trace_xe_event_map em ON te.trace_event_id = em.trace_event_id
LEFT JOIN sys.trace_event_bindings tb ON em.trace_event_id = tb.trace_event_id
LEFT JOIN sys.trace_columns tc ON tb.trace_column_id = tc.trace_column_id
LEFT JOIN sys.trace_xe_action_map am ON tc.trace_column_id = am.trace_column_id
ORDER BY te.name, tc.name
Now, I am not going to walk through creating a XEvent because that would take a full post to do so. There are a lot of great how to blogs out these which I encourage you to seek out.
Dynamic Management Objects
SQL Server is great at letting us see under its hood. A great way to do this is querying Dynamic Management objects. It provides hundreds of views containing system information to help you both monitor instance health and diagnose problems within SQL Server. These objects can either be views (DMVs) or functions (DMFs).
These dynamic management views are what you should be familiar with and use first when looking to any performance issues or you need to know what is going on right now with your SQL Server instance. It is important to note to view many of these objects you will need to have the VIEW SERVER STATE permission or VIEW DATABASE STATE with the database you are monitoring.
Azure SQL Database will have a slightly different set of DMV available and your Virtual Machines or on Prem SQL Server instances. Some objects will only be available or applicable to the Azure.
I have laid out which you should become familiar with in my blog DMVs for Beginners.
Summary
Performance monitoring is an essential part of database and instance health. Creating a baseline and knowing your performance thresholds are the first steps in doing that. In this article, we reviewed what metrics you should be baselining and what tools you can use to gather that information. We dove into the built in Windows Performance Monitor as well as SQL Profiler provided with your SQL Server install. Then we reviewed the newest SQL Server feature offering which combines data from both PerfMon and SQL Profiler into one easy to use tool called Extended Events. Lastly, we talked about the treasure trove of information provided with the database engine that we can access via Dynamic Management Objects. Getting the best overall performance from your applications starts with being able to understand what is going on within your SQL Server instance. This should be high on your performance tuning and troubleshooting list.
SQL Diagnostic Manager for SQL Server monitors the performance of your entire SQL Server environment and provides the most comprehensive diagnostics on the market. Learn more here.