This is the second part of a three-part series of blog posts. Read also the first part. Click here to view the third part.
Get Overview
The OVERVIEW page, which is the initial page, gives you a high-level view of your environment. You get a quick view of the number of down servers, servers with critical alerts, and servers with warnings.
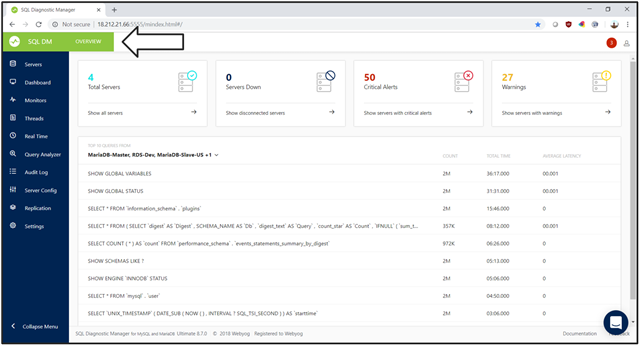
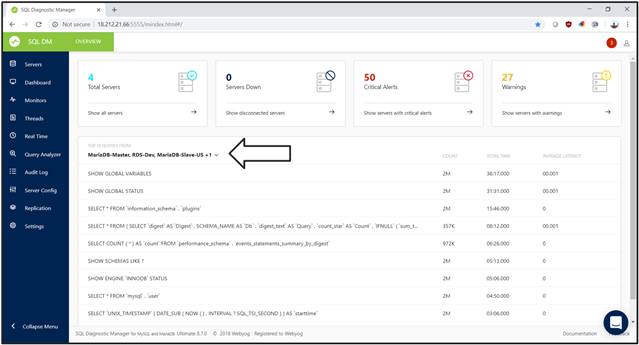
The lower part of the OVERVIEW page shows the TOP TEN SQL statements for the selected servers. Use tags for this list. Select this field, and quickly specify either PROD, an application, or a cluster. And see the TOP TEN SQL statements across that group of servers.
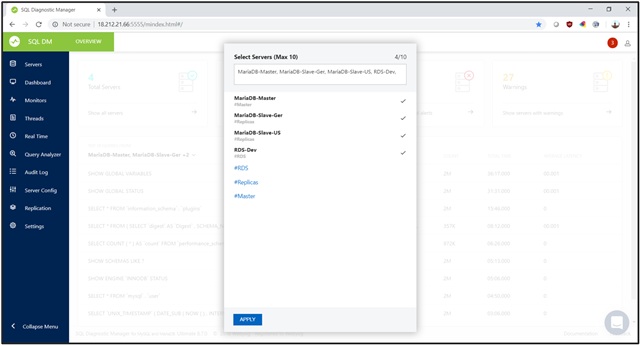
Specify which servers to include on the OVERVIEW page. Select either individual serves or tags and then servers. This way you can quickly focus on either an application, a cluster, or whatever group of servers is important to you.
Navigate Dashboard
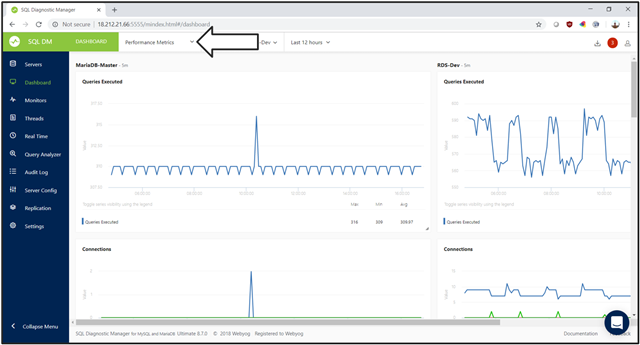
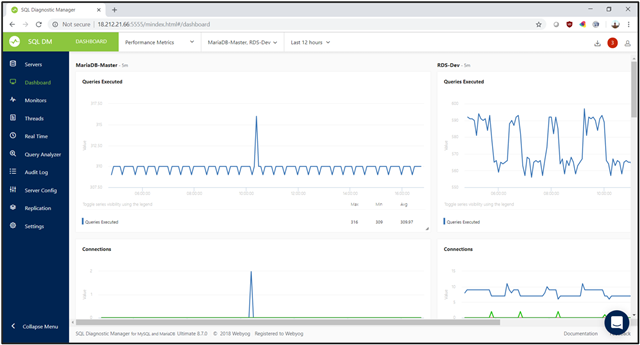
The DASHBOARD is a series of pages, and each page is a series of graphs. The DASHBOARD as a quick view on the health of your MySQL instances and application. The DASHBOARD allows you to create pages of the metrics that are most important to you. See the DASHBOARD on your workstation. And display the DASHBOARD on a monitor on a wall over a workgroup automatically refreshing on a regular basis.
Create, edit, and delete entire pages in the dashboard.
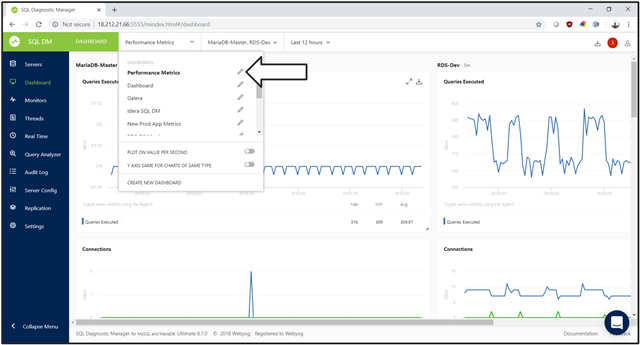
Each page consists of a series of charts.
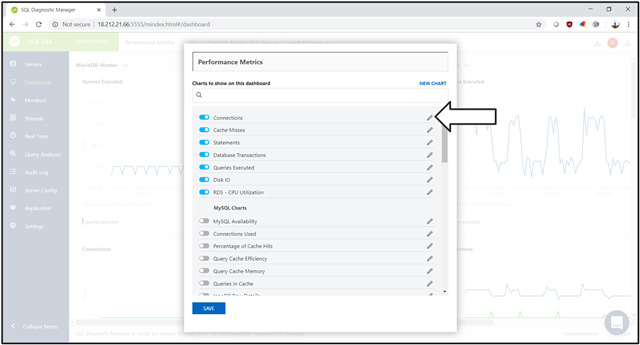
You can identify the six to eight critical measurements that are important to you and your team. The dashboard can then be configured to show those metrics. The dashboard can be set to autorefresh and can be continuously displayed on a monitor over a workgroup, giving everyone a quick view on the health of your environment.
The dashboard is a highly customizable platform for showing fundamental values that can be viewed on your monitor, and on a monitor over a team of database administrators.
Access Monitors
SQL Diagnostic Manager for MySQL comes with over 600 out-of-the-box monitors that measure and report on activity. As with the other pages, for the MONITORS page, use the first field to specify which servers that you want to see. You can also specify the time frame over which you want to look at data. The product uses the metrics to measure configuration and performance to notify you when problematic behavior begins to occur.
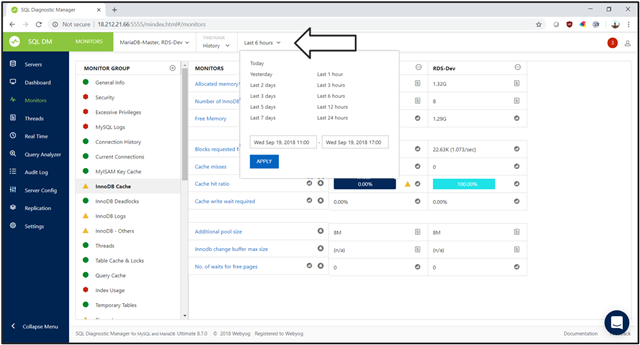
Groups
The product gathers monitors into MONITOR GROUPS. Within each group, see the individual monitors. Some, which have a graph icon, can show you a history of values for whatever they measure.
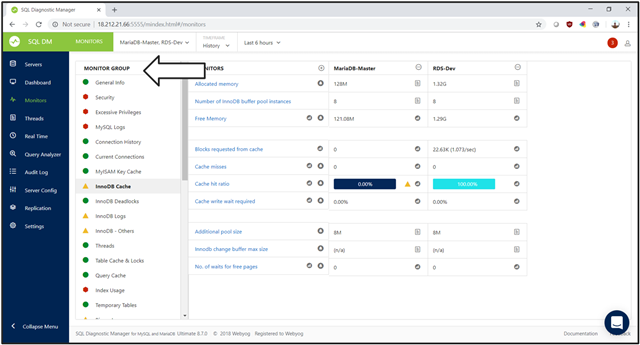
Charts
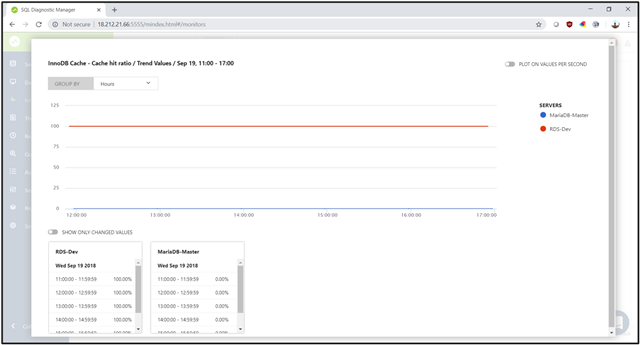
When you select the chart icon for a monitor that display its chart.
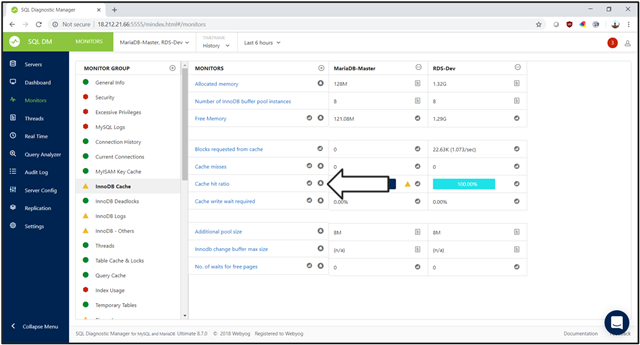
The chart shows you the measured value of the monitor, for the selected servers and period.
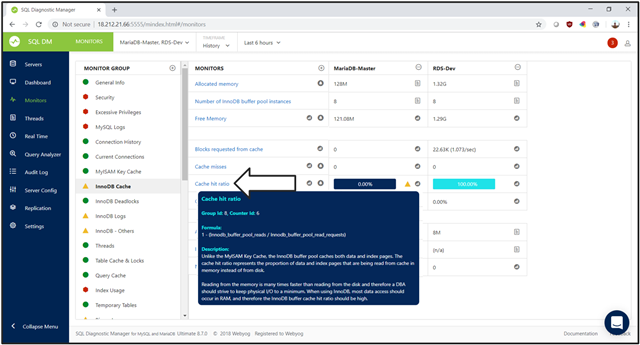
Description
Hover the mouse pointer over a monitor to see a description.
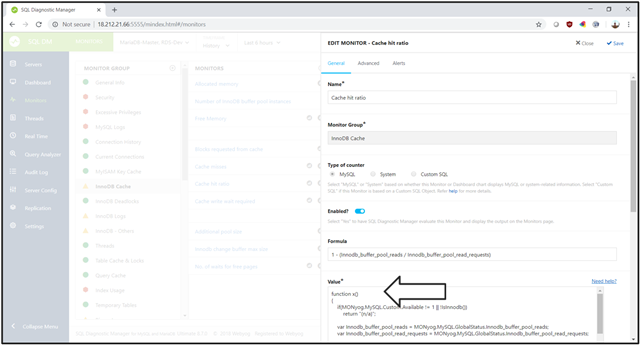
Edit Monitor
Choosing a monitor allows you to configure it.
Value
All monitors have an attribute called Value. That attribute is the value of the metric that the product measures. An attribute is either a number, a ratio, or a series of names. Values are written in JavaScript. This monitor uses several attributes in the Monyog Object Model (MOM) to calculate the percent of cache hits. The MOM, including where the product collects the data, is documented in the online documentation.
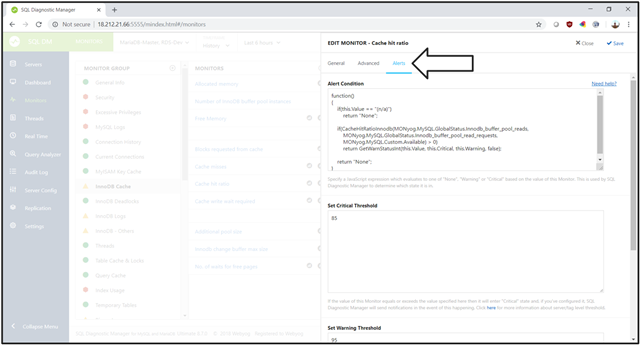
Alerts
Monitors can also be used to show alerts. Monitors are where the critical and warning messages originate. The Alert Condition function is a JavaScript function that is fully exposed. In this case, the JavaScript function checks the returned value, and the JavaScript function compares the value to the thresholds defined below. You can modify this JavaScript code.
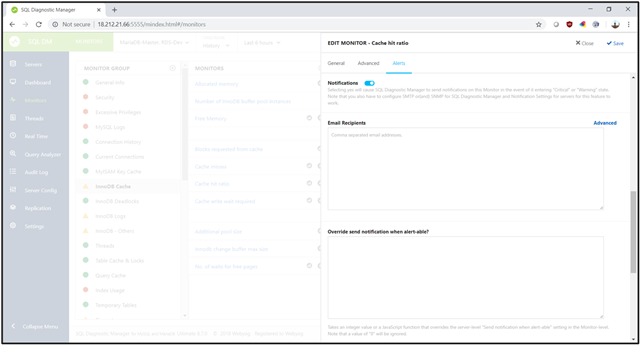
Notifications
Also as part of the alert, send emails and other notification when an alert goes to either yellow or red. You have quite a bit of control with thresholds, requiring a certain number of critical reads, and so on to ensure that SQL Diagnostic Manager for MySQL notifies you but not getting too many notifications.
It is a problem when an alerting system sends you so many alerts that you create mail rules that throw all of the alerts into a folder you never view. That is a dysfunctional alerting system. The product has enough flexibility to limit the number of false positive messages.
Flexibility
Concerning alerts, the product is flexible. You can create your counters which can gather data from your MySQL instance via SQL queries. Monitor anything that SELECT returns. Then write your custom monitors for that custom counter.
For example, suppose that your application has a table that represents a job queue. When the products submit a job, the product inserts a row. When a job completed processing, the product deletes the row. The number of rows in the table represents how many jobs are queued but not being processed. You can create a custom counter that does merely a SELECT COUNT(*) statement on this table. The data returned represents the number of jobs waiting for to process. Use the alerting section to set thresholds, say of 5 and 8, and now you get warnings and critical messages from the product when your application is not processing jobs.
If you can write SQL statements to gather data, then you can create monitors, charts, and alerts that act on those measurements.
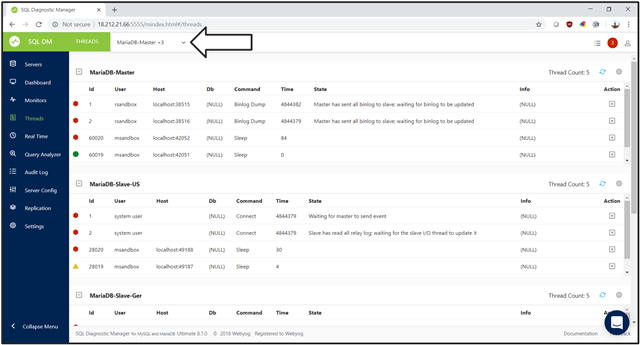
Monitor Threads
Threads, sessions, and processes are all synonymous within MySQL.
The THREADS page within SQL Diagnostic Manager for MySQL shows you the current sessions for the selected servers. Perhaps you saw something on the dashboard, or you received an email from an alert telling you that either deadlocks were occurring or processing use was high. The Real Time monitoring shows you the threads that are currently active, as well as their status, SQL, and other information. You can kill threads from here, as well.
Monitor in Real Time
While the THREADS page shows you what is occurring at precisely this moment, Real Time is a continuous monitor that gathers information about MySQL processes. Real Time works on a single instance at a time, sample once per second gathering information about MySQL. A monitoring session can last minutes or even days. Real Time monitoring sessions are an excellent way of gathering information about real activity in the instance and saving that activity for later analysis. Refer to the REAL TIME page.
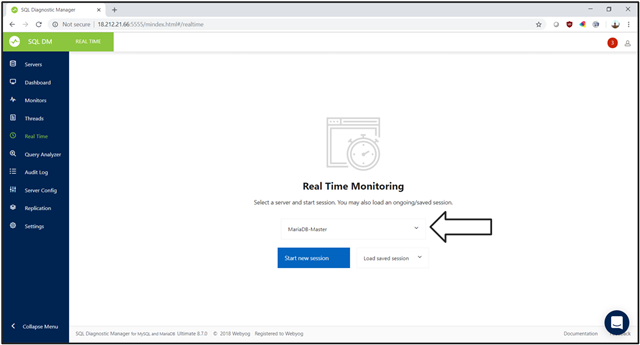
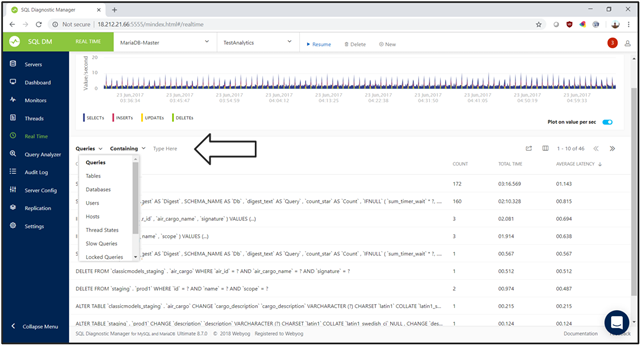
The REAL TIME page displays a previously saved Real Time monitoring session. The page shows you the events occurring within the database, at the top, and the individual SQL statements, at the bottom. Change the information on the bottom to tables, databases, users, and other entities.
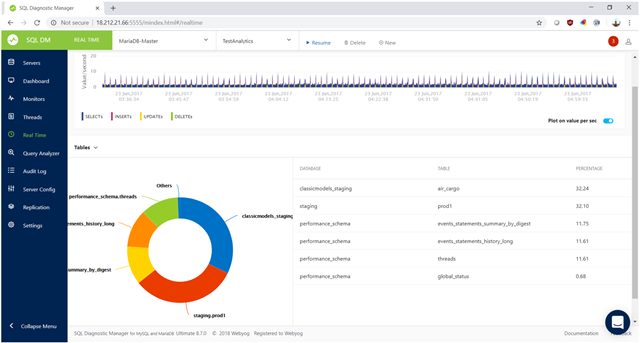
Here we see the activity during the selected time frame broken out by the table.
Use real-time monitoring in several ways. First, an ongoing situation is occurring right now. Your application is slowing down. Start a real-time monitoring session to get a record of what is happening and where the system generates the activity. Second, use this to benchmark critical functions. Suppose that you have either an Extract, Transform and Load (ETL) or a report generating a process that runs over the weekend. Run real-time monitoring over the weekend to get a view of how that job is working.
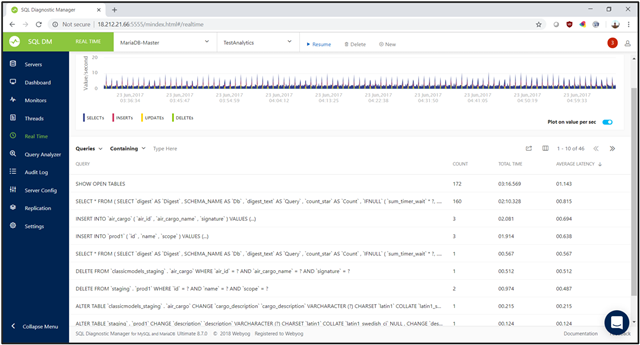
Information about each of these objects can help you quickly identify statements, tables, locks, and other areas where MySQL spends most of the processing time. Improve the overall performance and speed of your database by focusing on improving the performance of those objects.
This is the second part of a three-part series of blog posts. Read also the first part. Click here to view the third part.
For SQL Diagnostic Manager for MySQL, view the product pages, browse the datasheet, read a case study, download the free trial, request a live product demonstration, request a price quotation, and purchase in the online store.