SQL Doctor diagnoses and provides the cure for what ails SQL Server on premise, in the cloud, and as a managed cloud database.
Collect performance information, analyze it, and determine the resolution in minutes rather than hours. Leverage proven industry best practices endorsed by Most Valuable Professionals (MVPs) to analyze the performance and to provide recommendations. Target some of the most common areas of performance problems, such as queries, server configuration, security, database objects, memory, wait statistics, query plans, and much more.
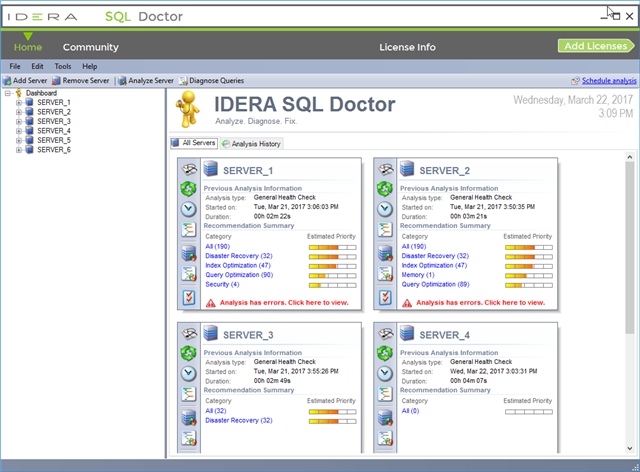
Quickly see the overall health of all registered servers, based on the last analysis run. Access quick links to the shared tasks for a server such as updating SQL Doctor settings, reviewing wait stats, and analyzing a query.
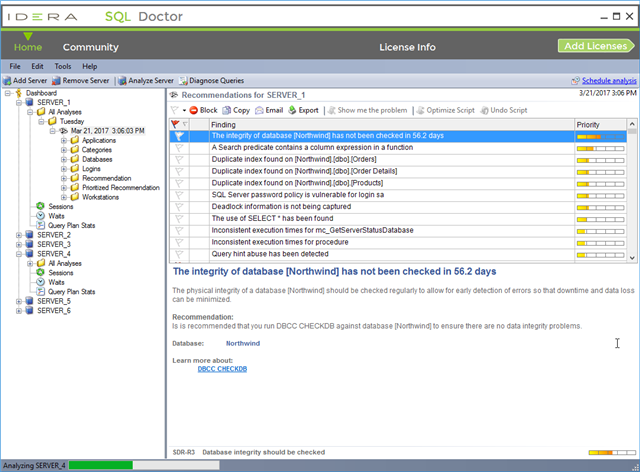
View a list of performance recommendations based on a full analysis based on selected criteria. The performance gain that was received from making the suggested change, how relevant it is for the parameters that were specified when configuring the analysis, and the confidence SQL Doctor has in the recommendation determines the priority of the recommendation. Narrow the recommendations by targeted applications, selected performance categories, databases on the server, logins at the server or database level, frequency of specific recommendations, prioritized recommendations, and workstations associated with the server.
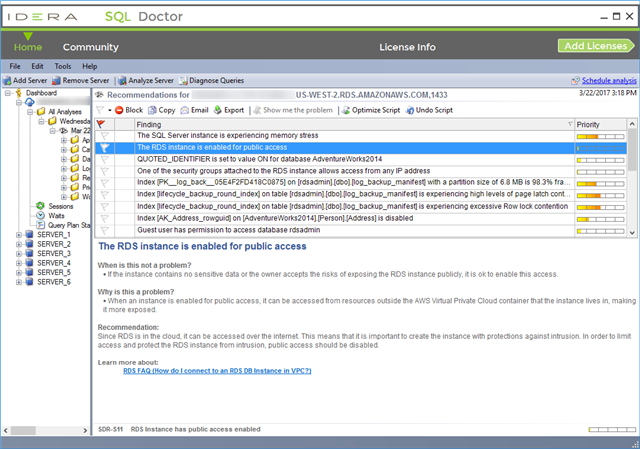
View detailed information about each recommendation. In many cases, this includes the actual metrics, databases, tables, and applications involved. Perform these actions: Flag, block, copy, email, and export, show me the problem, optimize script, and undo script. This example lists the details for a cloud recommendation for Amazon Relational Database Service (RDS). SQL Doctor also supports Microsoft Azure SQL Database.
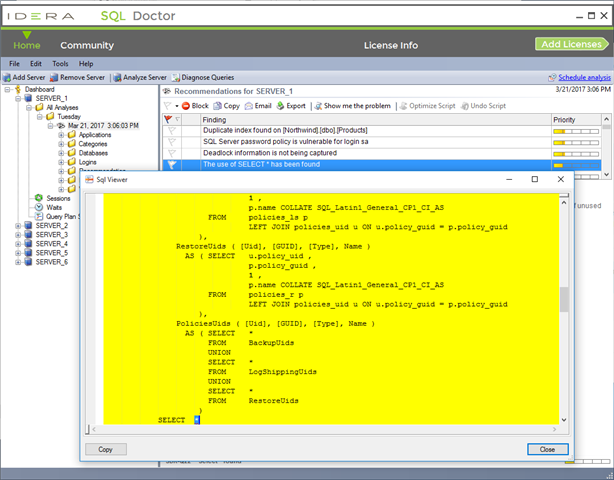
View the SQL text for a selected recommendation. Copy the SQL text to the clipboard to see it in a text editor or SQL Server Management Studio.
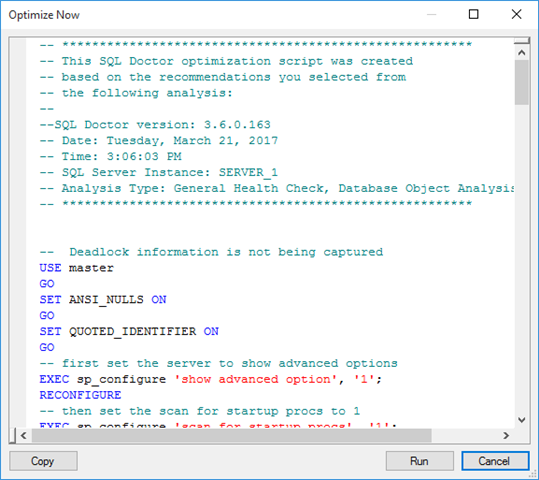
Display the script that used to enact the recommended change. Alternatively, copy the script to Windows Notepad or another text editor to examine the code and research other options further before making the change.
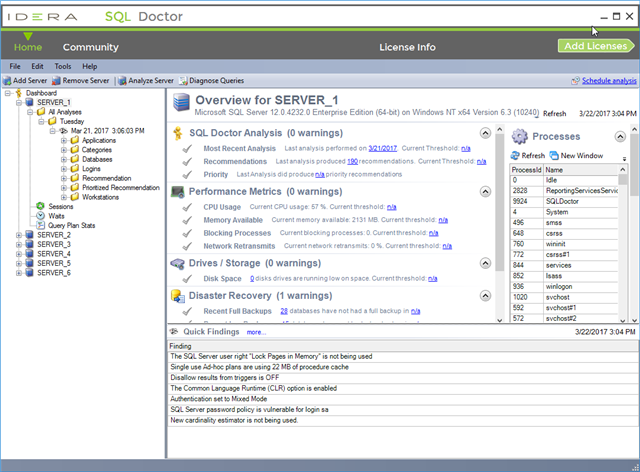
Quickly see the overall health of each registered server, as of the last refresh. See a server health checklist that highlights where performance issues may be happening in real time. Review real-time, key performance metrics for each major area of the server. Display quick findings based on the values of the key metrics to start troubleshooting performance problems immediately.
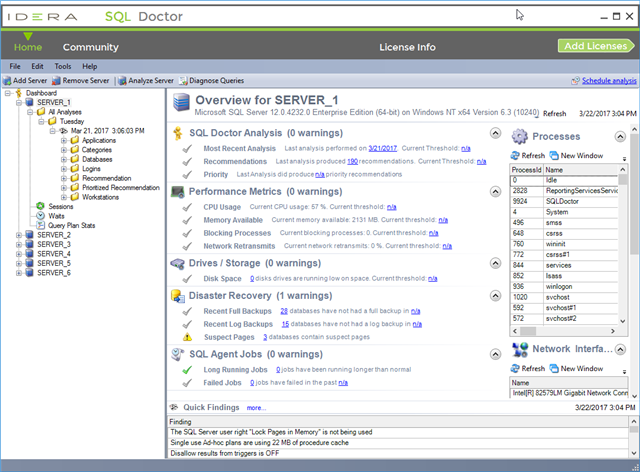
A fast and therefore limited look at critical real-time performance metrics (including queries, sessions, wait stats, and query plans) determines the quick findings. They point in the correct direction and give crucial troubleshooting information when it is needed most. However, for a thorough review of server performance, refer to recommendations generated by a full analysis.
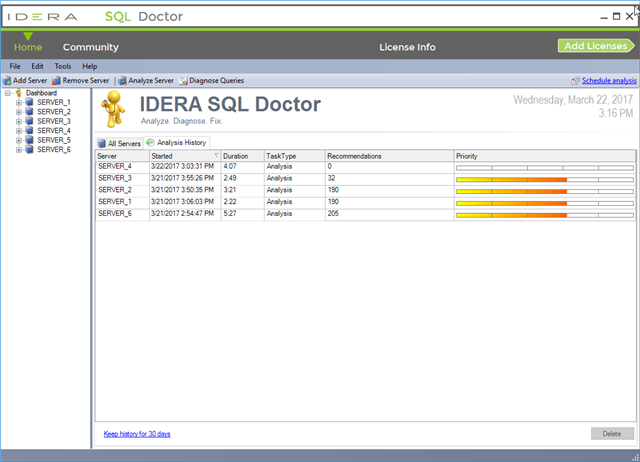
Access the results of every analysis stored by SQL Doctor for each registered SQL Server instances. Summaries include the name of the analyzed server, start time, total time duration, type of analysis performed, total number of recommendations, and highest priority recommendation. For each historical analysis, view recommendations, and delete and schedule an analysis.
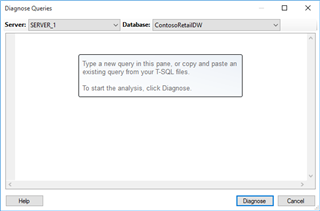
Analyze relevant queries without having to wait for a full analysis to complete to help save time. When SQL Doctor diagnoses a query, receive performance recommendations without actually executing it. When clicking the “Diagnose” button, it parses the T-SQL script and bases the analysis and resultant recommendations on the estimated execution plans for the selected database.
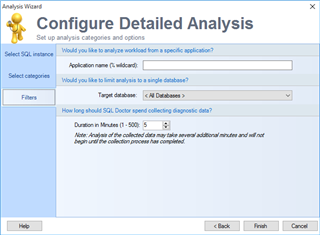
When configuring the analysis, choose which database or application workload to include in the analysis. Fine-tune the analysis results further by picking a database or application. Maximize the likelihood that the recommendations accurately identify and resolve critical issues by adjusting the amount of time duration for collecting data.
Watch the video for more details:
![]() Try it yourself by downloading the free 14-day trial.
Try it yourself by downloading the free 14-day trial.