If you are a developer, you might have heard this from your DBA – “That query plan has some problems”. This blog would help you in understanding those “problems” which DBA might be talking about. We would talk about tips which can help a developer in finding some of these “problems” themselves without getting deeper into the topic.
There are two types of plans SQL Server engine can generate in general. They are known as “Estimated” plan and “Actual” plan. When we ask for estimated plan from SQL Server it would not execute the query. So this mechanism would be useful in situations where we are dealing with long running queries. Estimated query plan represents the calculation done by optimizer. On the other hand, the actual execution plan executes the query and shows the query plan. Generally, actual execution plans are preferred because they have the capability to show execution statistics like number of rows returned by an operator as part of the query plan.
We are going to focus on graphical query plan because they are a good start point for a developer while doing query tuning. There are multiple ways to generate graphical plan for the query.

Estimated Execution Plan
Estimated graphical execution plan can be seen using SQL Server Management Studio (SSMS):
- “Display Estimated Execution Plan” icon in toolbar.
- Using Ctrl + L on keyboard.
- Right Click in Query windows and using “Display Estimated Execution Plan”.
- In Query option in menu bar and using “Display Estimated Execution Plan”.
Actual Execution Plan
Actual graphical execution plan can be generated and viewed in SSMS using below methods:
- “Include Actual Execution Plan” icon in toolbar.
- Using Ctrl + M on keyboard.
- Right Click in Query windows and using “Include Actual Execution Plan”.
- In Query option in menu bar and using “Include Actual Execution Plan”.
Once you have generated the query plan, there are various thing to watch out for. We are calling out some of the basic information to lookout for:
- Arrow Thickness: Look at thickness of the arrow in the query plan. The thickness of the arrow is relative to amount of rows passed. More thickness means more rows. This gives visual indication of the possible performance issue which we might want to have a look. If we move the mouse pointer over the arrow, it shows number of rows as a tooltip. Below is an typical example to illustrate the same:
- Percentage value in each operator: For each icon, which represents an operator, there would be a cost associated. This cost is relative to overall cost. If we sum all percentage values, they would add up to 100%. Generally more cost represents the area where we need to put our focus and see if something can be done to reduce it. In below image, we have highlighted cost of each operator.


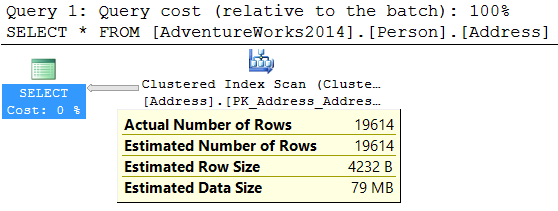
- Estimated vs Actual rows: Every operator’s tool tip in actual execution plan shows estimated number of rows and actual number of rows. Estimate number of rows represents the number of rows which were estimated by optimizer based on statistics gathered from the underlying table or index. If there is huge difference in values, these might indicate that latest statistics were not given to optimizer. This could be because the statistics were not updated with FULL SCAN. Depending on current state of statistics, one possible solution might be to update the statistics of various tables used in query using full scan option.

- Missing Index: Sometimes optimizer can suggest a missing index in a query plan. We can right click on that detail and use “Missing Index Details” and get more details about missing index which optimizer thinks is useful. This should be treated as quick fix to solve a performance issue related to this particular query. Impact of Index has to be evaluated before implementing in production server.

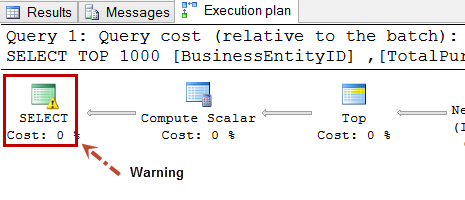
- Warning Symbol: Graphical query plan can also show warning symbol for many situations. One such Warning – Operator used tempdb to spill data during execution.

Other type of warning can be got for Type conversion in expression (CONVERT_IMPLICIT(<>)). This may affect "CardinalityEstimate" in query plan choice.
As we sign off, these were some of the common operators or things we expect developers to lookout for when they are working with execution plans. Hope this list can give an initial start to a developer and help in grabbing low hanging fruit while doing performance tuning. Performance tuning in itself is an tough and long topic and we have just touched the surface as part of evaluation of execution plans.
|
|
About Pinal Dave Pinal Dave works as a Technology Evangelist (Database and BI) with Microsoft India. He has written over 2000 articles on the subject on his blog at http://blog.sqlauthority.com. During his career he has worked both in India and the US, mostly working with SQL Server Technology – right from version 6.5 to its latest form. Pinal has worked on many performance tuning and optimization projects for high transactional systems. He has been a regular speaker at many international events like TechEd, SQL PASS, MSDN, TechNet and countless user groups. |
