When looking at a database to improve performance, I look at three types of tuning; statement, object, and instance. I want to walk you through some of the tools and features available within the Precise for Database solution that can help you identify problems and solutions related to object tuning, in particular, with looking at how tables and indexes are used in SQL statements.
Because Precise is a 24×7 monitoring solution, it will capture database performance for Oracle, MS-SQL, DB2, or Sybase around the clock. While some tools require you to manually start and stop them, Precise will continuously gather data throughout the night and weekends, over holidays, and during end-of-year or end-of-quarter processing. The data you see in Precise comes from real users generating real database activity.
Precise keeps this data, including SQL statements, execution plans, and object information for up to three years, by default. You will gain unprecedented insight into how objects are accessed and how indexes are used, or not used!
First, let’s look at the Objects workspace within Precise for Oracle. There will be slight differences in the other databases (MS-SQL, Sybase, DB2), but the process of identifying objects and their usage is the same.
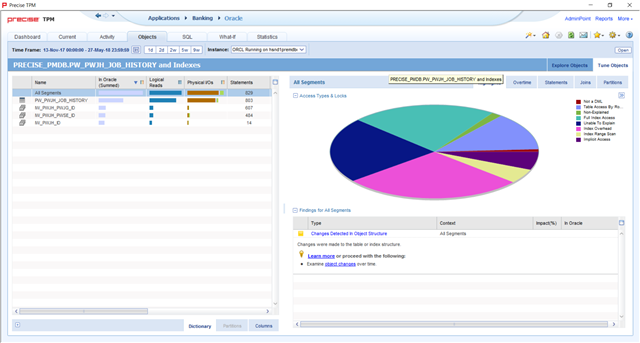
Notice that I have a very wide time frame: the last six months. When using Precise to analyze table and index usage, it is very helpful to look at a broad span of time. I had selected this particular table (and its objects) because it ranked relatively high compared to other tables on the “Explore Objects” tab. However, I may also have found this table in the Activity workspace and chose to analyze it because of its importance to my application. Precise offers “Tune Object” icons in various workspaces and “Tune the table” links in findings.
On the left, I have “All Segments” selected. I could also select the table or individual indexes. Columns on the left side include total “In Oracle” time, I/O stats, as well as how many statements are accessing the particular table or index. This is helpful to identify underutilized indexes. I can highlight a particular index on the left, and I can see how much time was spent on Index Overhead. This may point me to an index that is rarely used but has high maintenance costs.
On the right, I see how that object is accessed. Notice that the pie chart shows a variety of access types, including Table Access by RowID, Full Index Scans, or Index Overhead. These are real numbers captured by Precise coming from real end-user activity in the database. As a statement is executing, wait events such as locks, I/O, index overhead, and others, include the object and block of the underlying object. Because of this, Precise can assign execution time to a particular table or index.
Notice also that Precise has Findings that can point me to trouble spots. As with all Findings, the “Learn More” link can be very useful in explaining what the finding is, and what typical causes and solutions are.
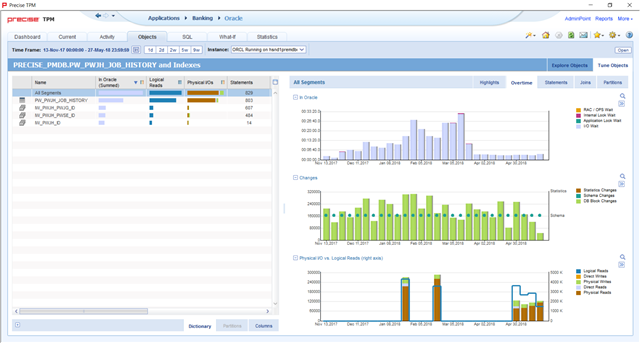
There are several tabs available on the right. These tabs are also quite useful in looking at how the objects are accessed. I can view activity related to these objects over time.
Probably most useful, I can also look at the table and index access types, then look at what statements are using that access type. This is an excellent way of identifying statements that are doing full table scans on large tables. In this particular case, there are no full table scans, but there are full index scans. By selecting that index type, I can drill down to see what statements have used full index scans on this table.
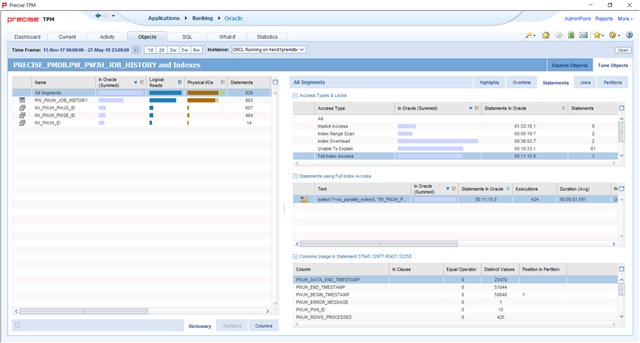
The small icon next to the “select” statement is a link to the Activity workspace. I can use that link to see the context of when the statement is executed, how often, and how fast it runs. If I decide that this is an important statement, I may choose to modify an index and use the “What-If” feature in the SQL workspace to see that index’s impact on all statements. Or, if I decide this statement is “fast enough,” I may choose to leave the indexes alone. Precise gives you the data you need to understand the importance of the SQL and the overhead of creating or modifying indexes.
The “Joins” tab will show me the other tables that this table is joined to, as well as the columns it is joined on. “Partitions” will show me the activity and wait time associated with individual table partitions.
As I’ve said, all of this data is coming from real users with real activity which is, ideally, what you need to tune your database for maximum performance. Precise is monitoring continuously and gathering performance data about not just SQL statements, but objects: tables and indexes. Precise can answer the what and when and how that allow you to tune your database to its utmost efficiency.a
While all of these examples were in Precise for Oracle, very similar analysis and data is available with Precise for MS-SQL, DB2, and Sybase.
To learn more about Precise for Databases or to schedule a demo, click here for Precise for Oracle, here for Precise for MS-SQL, here for Precise for Sybase, or here for Precise for DB2.