Some of you have already volunteered to participate in the SQL Diagnostic Manager 10.2 beta. For more information about how to add your name to our list of beta contributors, see the end of this posting.
In the meantime, as we prepare to begin the beta I wanted you all more information about the new functionality we will be asking you to test.
What’s Coming in Diagnostic Manager 10.2?
- Integrated Workflow with SQL Workload Analysis – A number of changes have been made for more effective use of SQL Diagnostic Manager and SQL Workload Analysis as a unified solution.
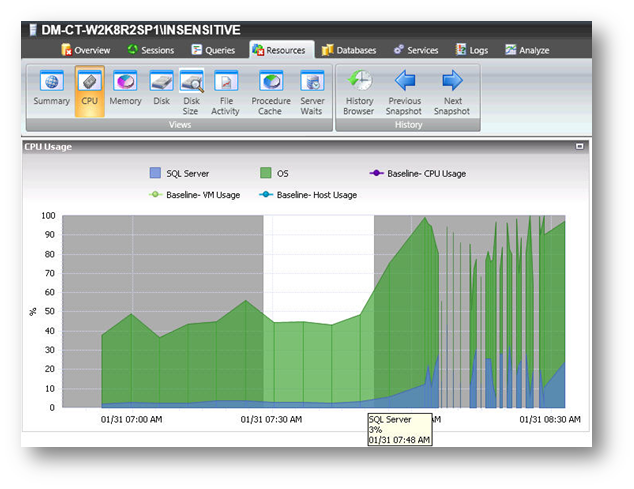
- Time-based drilldown in SQL Diagnostic Manager – In both the Windows Client and IDERA Dashboard, select any time range on any graph to zoom in for more detail and isolate that time range as you navigate to other graphs.
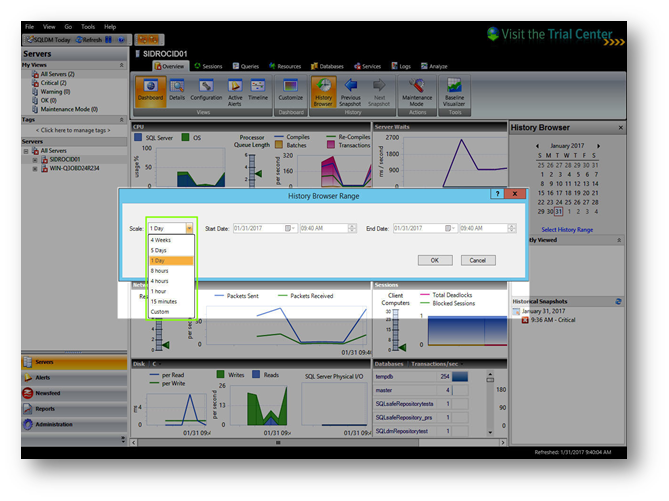
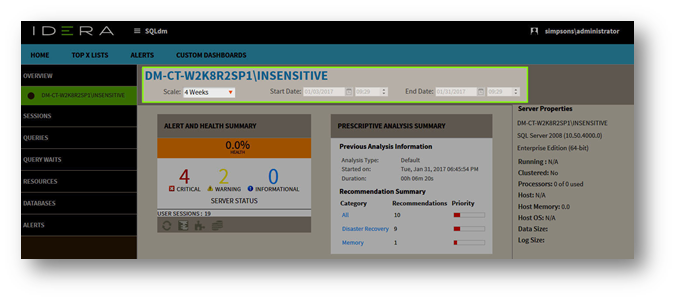
- History Range Control – In both the Windows Client and IDERA Dashboard, choose the range being displayed with a common control to specify start date and time and end date and time or select the most recent history.
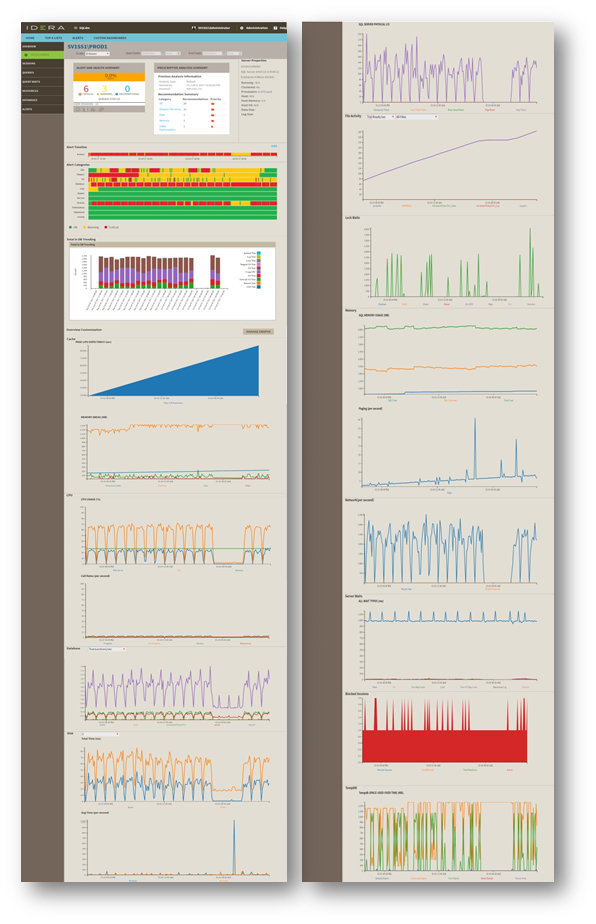
- SDM Pro Instance Overview – Combined information from various components of SDM and SQL Workload Analysis in a single overview with launch points to the respective components.
- Alert and Health Summary
- Prescriptive Analysis Summary
- Alert Timeline – Broken down to alert categories
- SQL Workload Timeline (From SQL Workload Analysis)
- Configurable Instance Summary Graphs – Select which instance summary graphs to display and how they are ordered. Vertically aligned to time correlate multiple performance metrics.
- Performance Improvements – Extensive scalability and user productivity improvements.
Please use the follow suggestions to quickly review the new functionality:
Preview Summary
Integrated Workflow with SQL Workload Analysis
SQL Diagnostic Manager allows you now to launch SQL Workload Analysis in context of your monitored server from the desktop console and the IDERA Dashboard.
SQL Workload Analysis dashboard displays trending database activity and top utilizing SQL statements, logins, machines, and programs.
Launch in context links between SQL Diagnostic Manager and SQL Workload Analysis, both can be launched to the same time range selection in either product.
- Simply, click the icon Launch SWA, located in the top right corner of the Desktop Console to de redirected to SWA Dashboard.
- The SWA launch icon is available in the SQLDM web console list sub-view.
Tip – When your SQLDM instance is registered in SWA the icon Launch SWA in the top right corner is displayed.
- Time-based drilldown in SQL Diagnostic Manager
In both Windows Client and IDERA Dashboard, select any time range on any graph available and zoom in for more detail and isolate that time range as you navigate to other graphs.
To select anytime range, follow these steps:
- Click the graph (Use any graph in the SQLDM desktop console or SQLDM web interface).
- Hold the left mouse button on the time position that is needed.
- Drag it to the left or to the right, and release the button.
- History Range Control
SQL Diagnostic Manager also includes a New History Range Control, located at the top of the Web Console and in the option History Browser in the Desktop Console, both can be modified and be designated a specific start time and date as well as current snapshot.
Follow these steps to configure the History Range of your SQLDM Desktop Console and web console:
- In the desktop console, click History Browser.
- Under the calendar select the option Select History Range.
- The History Browser Range window opens.
- Select the range from the drop down list scale, these options are: 4 Weeks, 5 Days, 1 Day, 5 hours, 8 hours, 4 hours, 1 hour, 15 minutes, and Custom.
- When selecting Custom, the user needs to select a Start Date/Time and End Date/Time.
- Click OK.
- Follow the same steps for the web console, after selecting the single instance view.
- SDM Pro Instance Overview
The new overview screen shows combined information from various components of SQL Diagnostic Manager and SQL Workload Analysis in a single overview with launch points to the respective components.
The single instance overview in SQL Diagnostic Manager web interface has a new dynamic overview page, which uses key information from both products (when the instance is monitored by SQLDM and SWA).
- Alert and Health Summary – This box shows the health index, alert status, and user sessions from SQL Diagnostic Manager.
Also, includes shortcuts to filter data through Sessions, Queries, Resources, and Databases.
- Prescriptive Analysis Summary – The prescriptive summary shows the previous analysis information and the resulting recommendations summary.
On the right side of the screen, the web console displays the Server Properties.
- Alert Timeline – This graph shows a summary of the alert categories, CPU, Memory, I/O, Databases, Logs, Queries, Services, Sessions, Virtualization, Operational and Custom. This graph is color-coded depending on the status of the alerts inside each category.
Configure the Alert Category graph, following these steps:
- Click Edit, located next to the Alert Timeline graph.
- Check or uncheck the checkboxes located under the Visible column.
- Or, reorganize the Order column with the listed numbers preferred.
- Click Save.
- Tip – Click any category of the graph to redirect the user to the active alerts list.
- SQL Workload Timeline (SWA) – The web console overview displays the Total DB Trending.
Click the graph to either drilldown to a different time range or to be redirected to SWA.
- Tip – The SWA Timeline or the Total DB Trending graph is not displayed when the chosen instance is not registered in SWA.
- Configurable Instance Summary Graphs – Select which instance summary graphs to be displayed and how they are ordered. They are vertically aligned to time correlate multiple performance metrics.
Follow these steps to manage the graphs to display in the overview of the single instance view:
- Click Manage Graphs in Overview Customization.
- Check or uncheck the checkboxes located under the Visible column.
- Or, reorganize the Order column with the listed numbers preferred.
- Click Save.
- Performance Improvements
SQL Diagnostic Manager Beta 10.2 has scalability and user productivity improvements which involves faster startup time, a new and faster connectivity between SQLDM and SWA, new screen displays to help a further drilldown for problem diagnosis and improve the overall workflow between screens.
The list sub-view in the SQLDM web console has a new display to help users to quickly identify the health status of the monitored instances, to navigate to the single instance dashboard, to quickly detect which instances are registered in SQL Workload Analysis, to have fast access to SWA interface whenever an instance is registered in this product, and to have a faster access to the active alerts and their status.
This new interface helps users to have a quicker assessment of instance status when comparing their instances. Also, the new display helps to coordinate operational and transactional diagnosis in context of each other.
Follow these steps to configure the displayed columns in this sub-view:
- To configure the list sub-view click Options.
- Choose the columns you want from the Available Columns list and drag them to the Displayed Columns in the right side list.
- Click OK.
We sincerely hope that this preview has encouraged you to try out the new features and add your voice to the chorus. We rely heavily on your feedback to shape future releases and prioritize efforts to make Diagnostic Manager even more useful.
I want to remind everyone that this beta release is still in test and therefore should not be installed over your production installation. There will be no upgrade path from the beta version to the final release. Please, test on a separate environment from any running licensed installations of Diagnostic Manager.
If you are interested in participation in the beta test of Diagnostic Manager 10.2 please e-mail scott.stone@idera.com


